I have plenty of unusual projects, but one of my favorites is my ever-growing personality test cross-reference project. This is a large database of individuals’ self-submitted personality types — Zodiac, Myers-Briggs, Enneagram, and of course Hogwarts house.
As of March 2020, there are over 2,600 submitted data points, and I’ve aggregated them and color-coded the correlations. The more red a percentage, the more uncommon for a individual who identifies with the (row) to be (column). The more green, the more common. This is based on the total percent of respondents for each column.
Here’s a brief look at how the spreadsheet works:
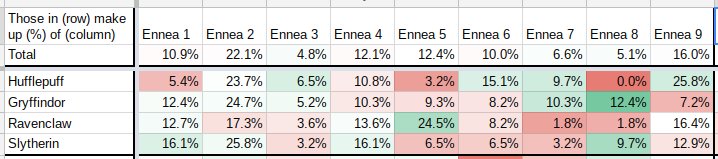
In the Hufflepuff row, we see that 5.4% of respondents who ID’d as Hufflepuff also ID’d as an Enneagram 1 – significantly less than the average number of 1s (10.9%). So Hufflepuffs are less likely to identify as an Enneagram 1 than they are a 3, 6, 7, or 9.
Go play around in the spreadsheet if you like, or submit your own information here!
FREQUENTLY ASKED QUESTIONS
“….why?”
Honestly, it was to impress a girl. Then it just lived on the internet for several years, and then Rachel Held Evans brought it up at a conference and suddenly the responses went from 300+ to 2,000+.
“….okay, but how?”
The data points are entirely self-submitted. People just wanted to play along. Creating the form itself took maybe half an hour. The aggregates, though, THAT took some work! I learned some fun stuff about Google Sheets / Excel including how to get a number of only certain entries in a column. Then I used conditional formatting, which I do have to set for each column rather than having it auto-correct every time I get new data.
“Your aggregate percentages don’t match what actual averages are in the real world.“
I’d hope not! I literally made this in a couple hours and then put it on Twitter. If it was that easy to get universally applicable statistics, I would have a lot of friends with useless graduate degrees. It’s just for fun!
“I know that I’m a [House] and a [Zodiac] so what Enneagram am I?!?!”
If I had an abundance of time and a better knowledge of spreadsheet coding, I’d love to create a results calculator that could do this! As well as a Unique rating where when someone puts in their four typologies they’re told how common, uncommon, or rare their intersections are. At this point, that all has to be done manually, and unfortunately this is not even close to my full-time job 🙂
“You should add D&D Alignment [or OCEAN or Handedness or Which Starter Pokemon You Choose]”
You’re right, that would be cool! Unfortunately, with 2,600+ data points already in the mix, trying to add in MORE is outside of my scope. But hey, you can make your own!
“Can I use this for a science project / my own project?”
Sure! The data is all anonymized so you’re not violating anything. Just add a link back to this page somewhere in your work so credit’s given where credit is due. (Unless you’ve figured out how to use this for nefarious world domination plots, in which case, I’d rather be left out of it.)